Georgia on Fire
Mapping fire prevalence using Kepler.gl
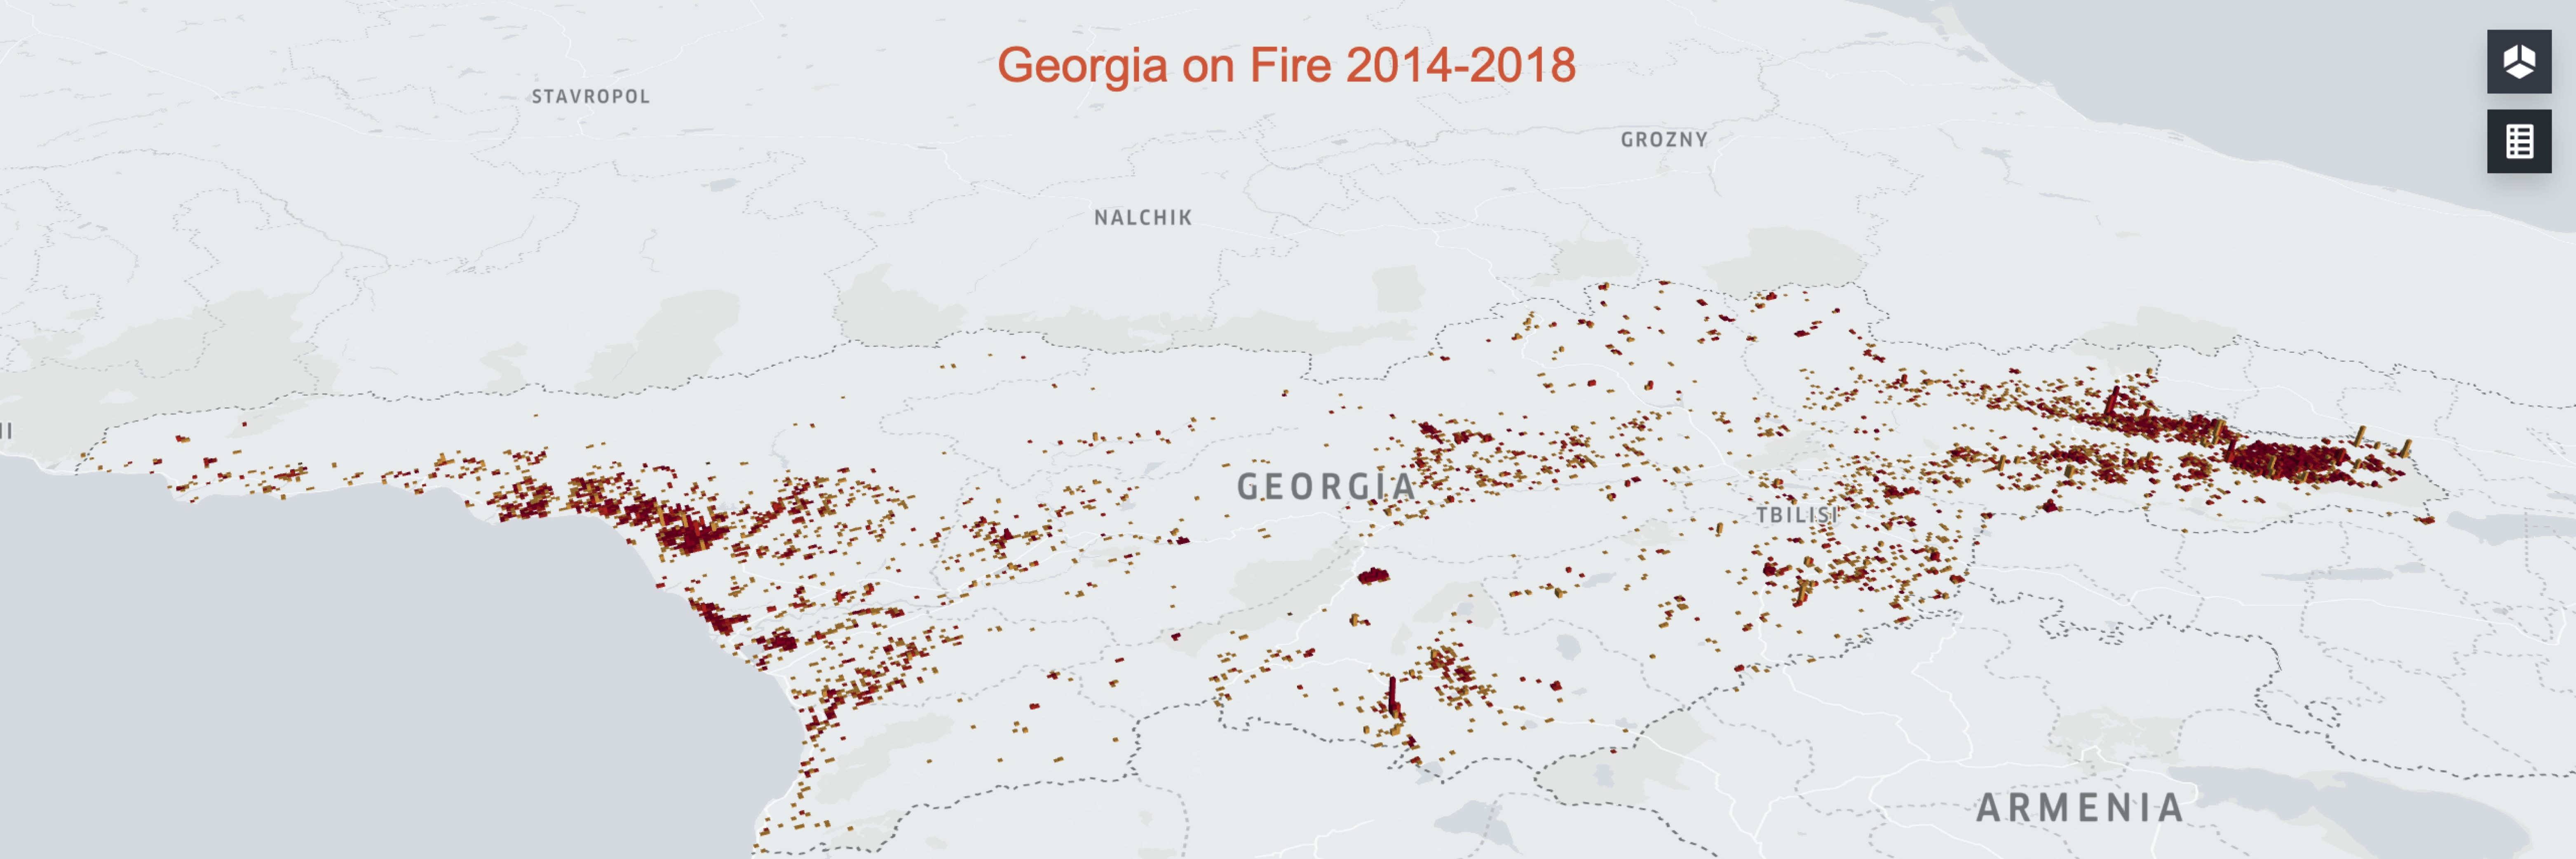
I built the interactive map embedded below, with kepler.gl - a python library using Jupyter NB. It is an open source geospatial visualisation platform launched by Uber’s visualisation team and enables users to perform various types of analysis such as heatmaps, choropleth, flows or grids, among others. Additionally, it allows to visualise data in either 2D or 3D and has built-in timeline capability.
To read the complete article, head over to our blog.
For a fullscreen version of the interactive tool, visit github page.
Tools Used: Kepler.gl library in PythonData: FIRMS by NASA